Aquaculture Predictions Are Not Linear: So Why Do We Constantly Look at It as One?

Aquaculture, much like any ecosystem, operates within a dynamic and multifaceted environment where countless factors intersect to influence fish health, growth, and welfare. Yet, when making predictions—whether about fish health trends, sea lice outbreaks, or optimal feed strategies—many in the industry rely on simplified two-dimensional data. Often, businesses measure variables like sea lice counts over time, because it’s easy to communicate in policy discussions or when setting KPIs. While this simplicity has value in stakeholder reporting, it limits the depth of understanding and fails to capture the complexity of aquaculture ecosystems.
In truth, focusing on just one or two variables can obscure the bigger picture. The industry should be measuring against a broader range of factors that interact in more complex ways, rather than reducing outcomes to a single time-variable relationship.
Aquaculture as a Complex Time Series
Aquaculture isn’t a simple, linear process. It’s a complex time series, where variables from both the past and present interact in non-linear ways. This interaction creates intricate feedback loops where multiple variables affect each other, resulting in outcomes that are hard to predict using traditional models.
For example, when analyzing sea lice counts, it’s tempting to look at yesterday’s environmental conditions and assume a direct cause-and-effect relationship. In reality, the situation is much more complicated. Data from two weeks ago, combined with present conditions—like temperature fluctuations, tidal flows, or even nearby treatments—might have a stronger influence than yesterday’s data alone. This interconnection creates a layered problem: which data points matter most, and how far back should we go when analyzing these variables?
Struggling to Quantify the Right Metrics?
Many industry professionals understand this complexity on an intuitive level. They know that predicting fish health or sea lice outbreaks isn’t as simple as comparing today’s data to yesterday’s. However, we often see companies struggle with how to quantify and measure the multitude of variables that could be influencing outcomes.
What’s truly important, and what’s just noise?
When it comes to reporting, this problem becomes even more pronounced. To communicate results effectively with stakeholders or policy-makers, the data is often reduced to two-dimensional metrics, such as quarterly sea lice counts or fish survival rates. While this approach is convenient for stakeholders, it can mask critical insights and oversimplify a process that, in reality, requires a multi-dimensional view.
Advanced Techniques for Identifying Key Metrics
To truly understand what drives fish health outcomes, we need to look beyond simplistic models and embrace techniques that can handle this complexity. In computer science, methods like Auto Correlation Functions (ACF) help identify how much a past value correlates with the current one. This allows us to determine how far back we should go to correlate data, like the sea lice levels from two weeks ago, and their impact on today’s values.
This is where advanced data modeling and feature extraction become essential. These techniques help farms identify the most important variables, filtering out the noise and focusing on the data points that really matter. For example, tidal flows or salinity might be far more influential over time than just tracking sea lice counts or temperature fluctuations. Identifying the key metrics allows for more accurate, predictive modeling that accounts for non-linear relationships.
The Role of Technology in Navigating Complexity
Aquaculture's future lies in technology that can manage these complexities—and this is where platforms like Manolin come into play. With data-centric AI, we’re able to collect, integrate, and analyze vast amounts of data from multiple sources. This data feeds into advanced models that recognize non-linear relationships, providing deeper, more accurate insights for farms.

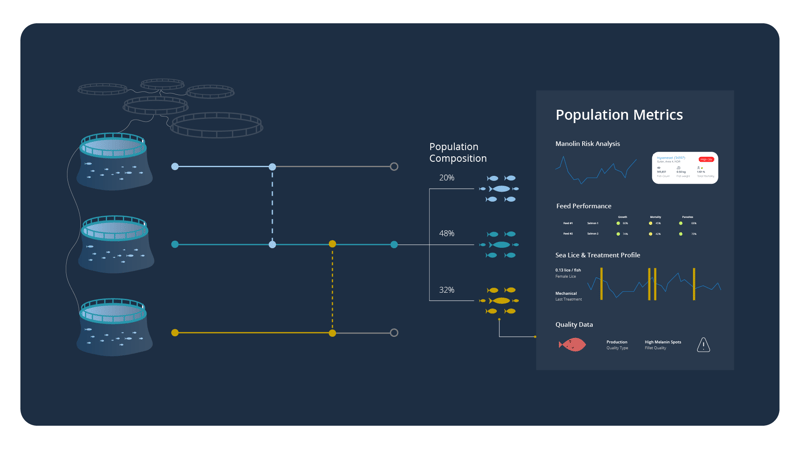
For instance, Manolin’s population tracing allows our models to more granularly track fish health across multiple variables over time, integrating everything from environmental conditions to treatment history. This holistic approach helps identify the true drivers of fish health issues and allows for smarter, more actionable decision-making.
Embracing the Complexity of Aquaculture Predictions
It’s time for the aquaculture industry to move beyond linear thinking. By embracing the use of advanced data models and techniques with Manolin, farms can identify the key metrics that matter most and improve their ability to predict and manage fish health.
Manolin users are already seeing the benefits of this approach—more accurate predictions, fewer unexpected outcomes, and a better understanding of the complex web of interactions at play. The future of aquaculture predictions lies not in simplifying the process, but in acknowledging and harnessing its complexity.