Our alerts and dashboard are designed to make it easy for farmers to back up tough daily production decisions with data — and build more sustainable longterm plans.
At Manolin, we believe that leveraging data is key to healthier fish, healthier farms, and healthier seas. Our alerts and dashboard are designed to make it easy for farmers to back up tough daily production decisions with data — and build more sustainable longterm plans.
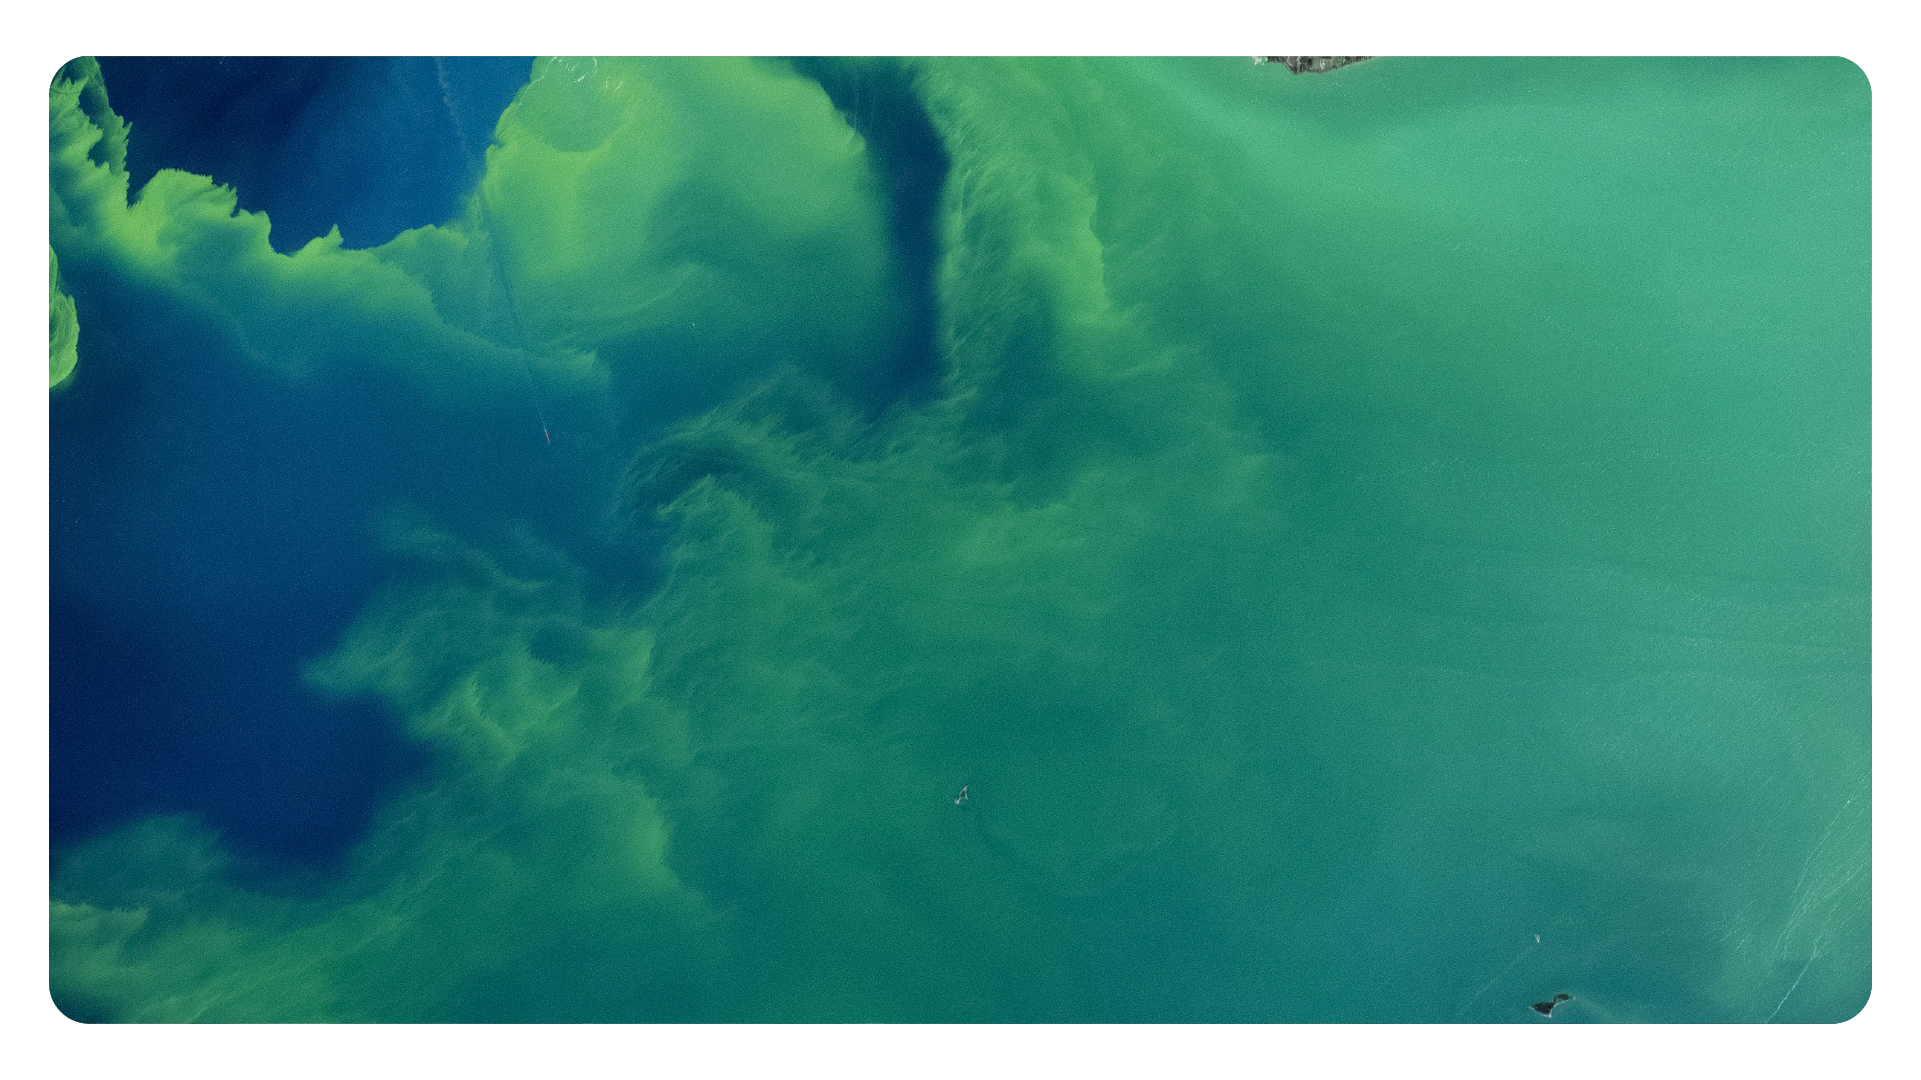
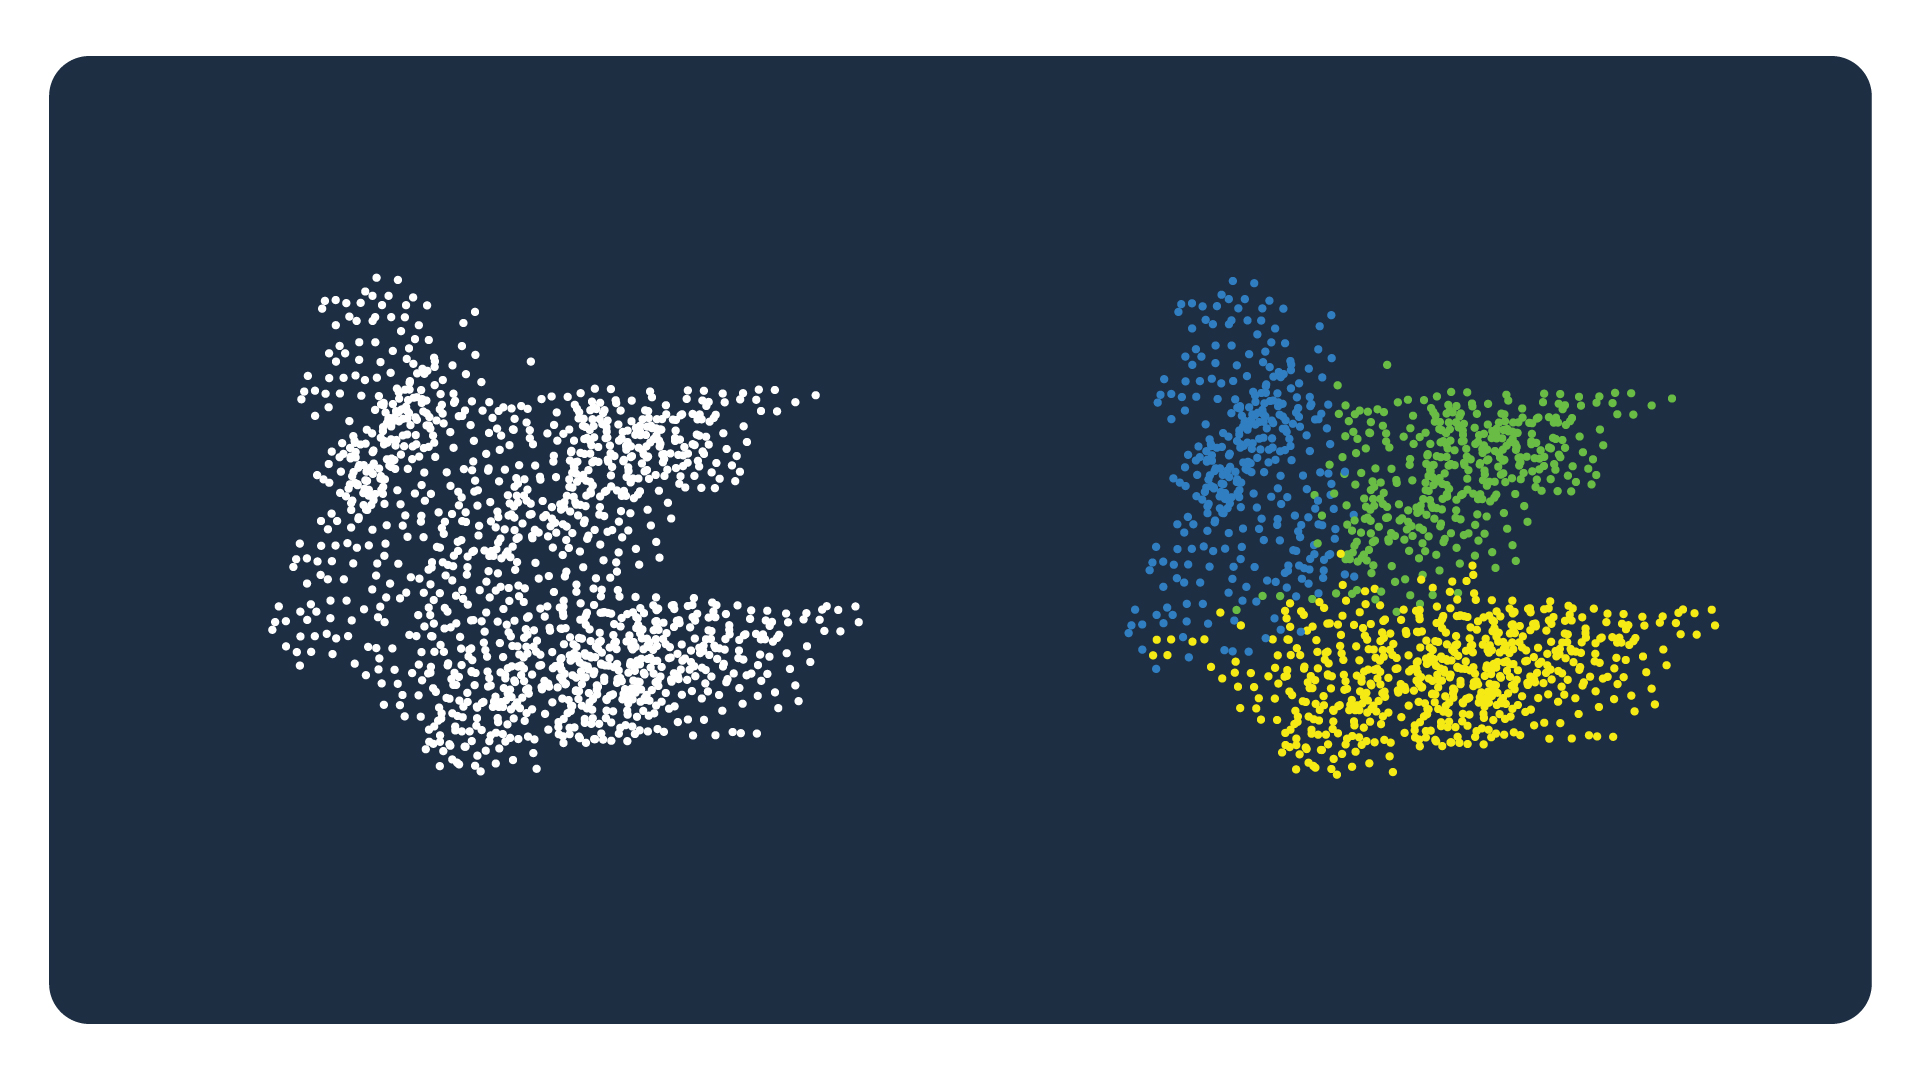
Now, we’re offering risk forecasting and centralized data archives for salmon farmers across Norway through our Essentials membership. By combining geospatial analysis and machine learning models with production data, we aim to provide farmers with a more holistic view of farm health.
“After two years of development, talking with farmers across the country, we see again and again that they are not getting the full value of all the great work they have done in collecting data,” says Manolin CEO Tony Chen. “Our goal is to make it as easy as possible for farmers to not only make tough daily production decisions but build long-term strategy. Healthier fish means healthier seas, and that’s better for business.”
We are working with a group of producers across Norway, integrating with products like Clarify (Searis) and other production systems to help make it easy for farmers to integrate existing data.
Torbjørn Gjelsvik, Chairman of Blom Fiskeoppdrett, says, “As an organization, we’re looking not only to identify critical areas of improvement but to use data as a central point to test and validate business decisions that must be made for our company to maintain its sustainability and success in the long run.”
Members also receive custom reports digging deeper into production analysis and industry trends. Current users — covering 42 percent of the industry — receive automated email alerts for nearby lice and treatment activity to enable preventive action.
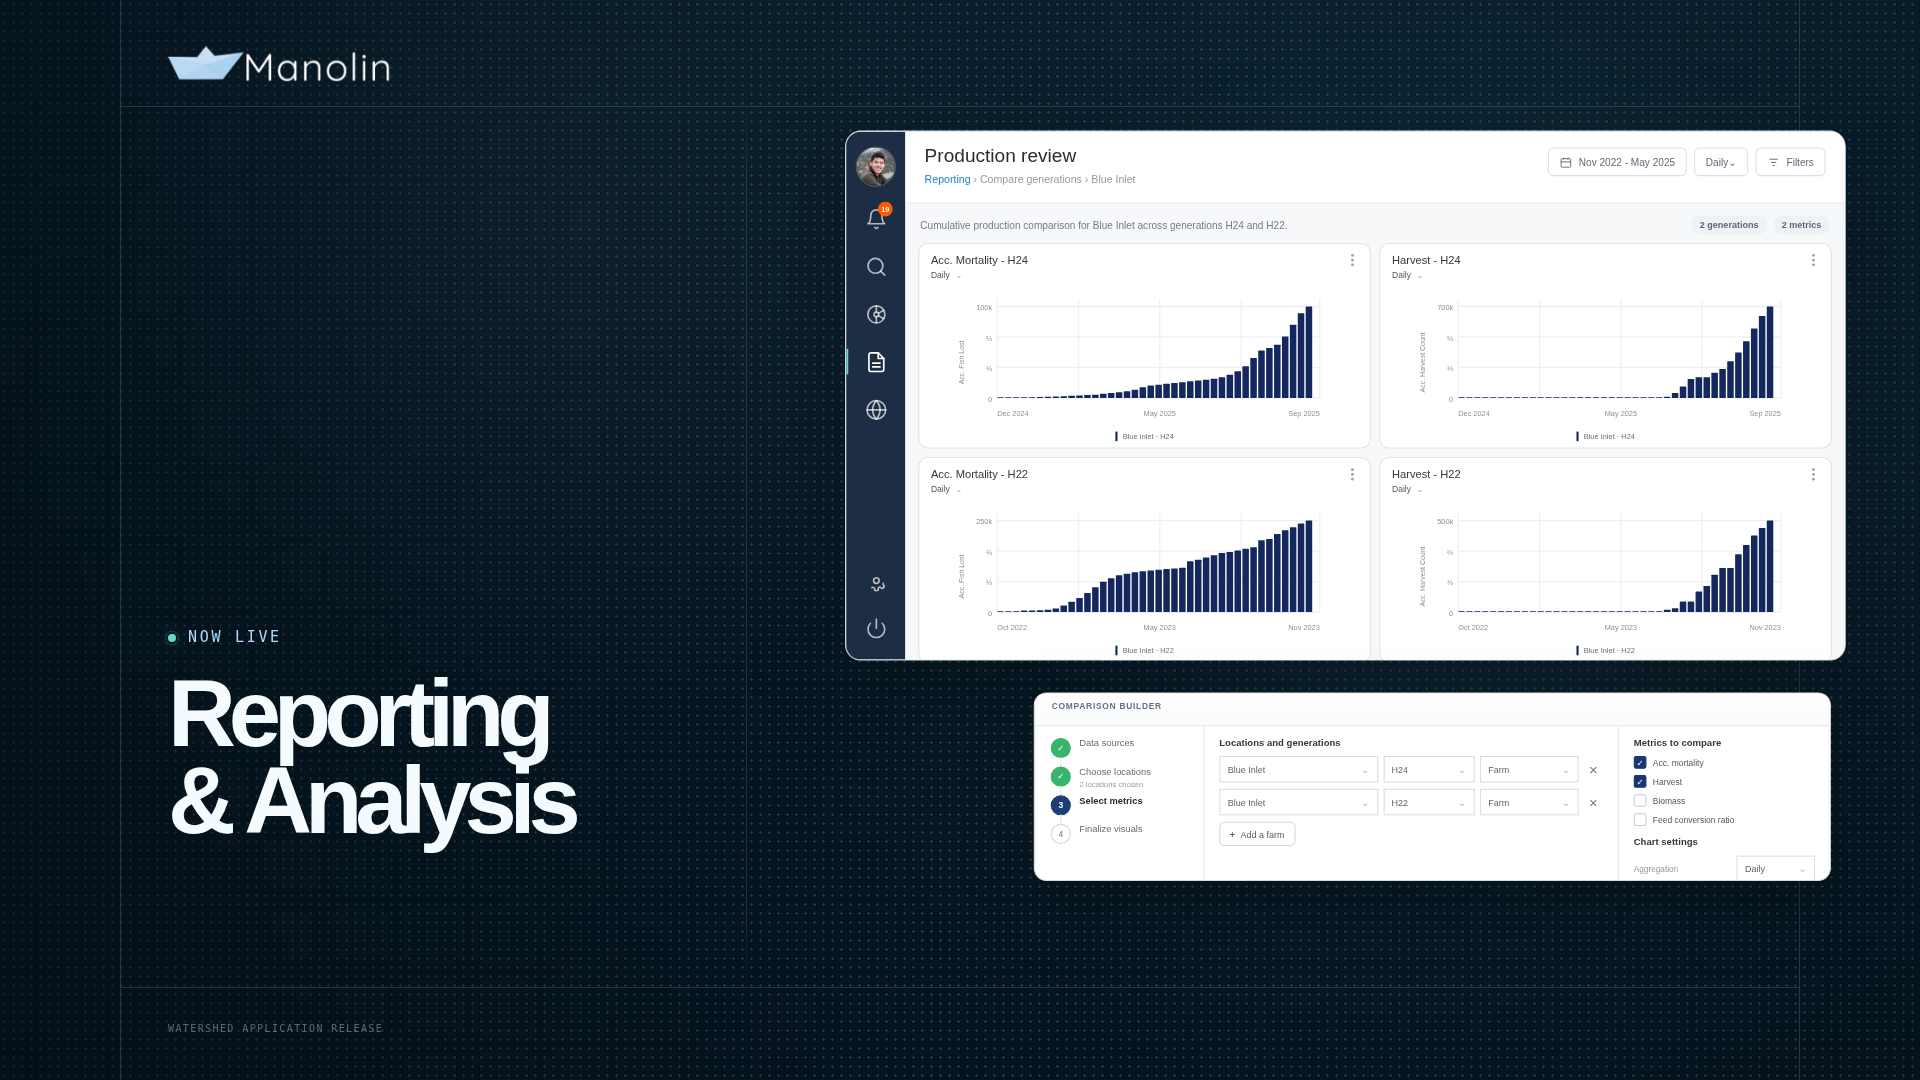
Here’s what’s new at app.manolinaqua.com:

- Historic regional analysis: Our new time-lapse tool visualizes how levels of lice, PD, and ILA move throughout Norway. Users can drill into each year, month, or week and see treatments happening in each production area.
- Private data integration: Manolin Essentials members can integrate production, health, and environmental data such as inventory, growth, feed, mortality, treatments, oxygen, and salinity. This gives a comprehensive data archive broken down by site, generation, and cage. We’ve now added information on the biomass slaughtered for each generation and a new lice tab, including timing and treatment type, so farmers can see how well their lice strategy is working.
- Advanced PD risk forecasting: Our health forecasting model identifies sites at risk of getting PD five weeks in advance. On our dashboard’s new risk overview page, Manolin Essentials members can dig into why each site might be at risk and download graphs or projections to easily share across their team.
For more information, visit www.manolinaqua.com. To learn more about Manolin’s membership options or to book a 15-minute online demo, react out to Natalie Brennan at nat@manolinaqua.com.