Imagine that in any given week, as a manager, you have to check the production system for biomass and growth, the feeding system for feed delivered, the camera dashboard for appetite and lice, an environmental portal for temperature and oxygen, and a lab portal for PCR results. Depending on your role, some of those get your attention every day and others only when something looks off. Then there’s the spreadsheet someone built to tie a few of them together, which only one or two people really know how to update.
Most of those systems are very good at what they do, but each one only holds a piece of the picture, and you’re the one left putting it all together.
You probably didn’t get into this industry to manage data sources. Most of the managers we work with got into it to grow healthy fish and help build resiliently productive farms. That’s why we built Manolin’s API, and why every farm on Watershed gets it. Below, we walk through how farms use it to pull their systems together and work with that data wherever they already do their analysis.
Too Many Systems, Too Many Signals
The industry has spent years investing in good technology: cameras that estimate weight and count lice, sensors that log oxygen, feeding systems, lab services, production software and public data from regulators. What it hasn’t had is a plan for making all of those systems work together.
Every supplier stores and shares data its own way, so the systems on a single farm don’t really speak the same language. Camera and sensor data live in one place, production records in another, and lab results arrive in a separate portal or as a PDF. Formats rarely match, and the same cage can go by a different name in each system.
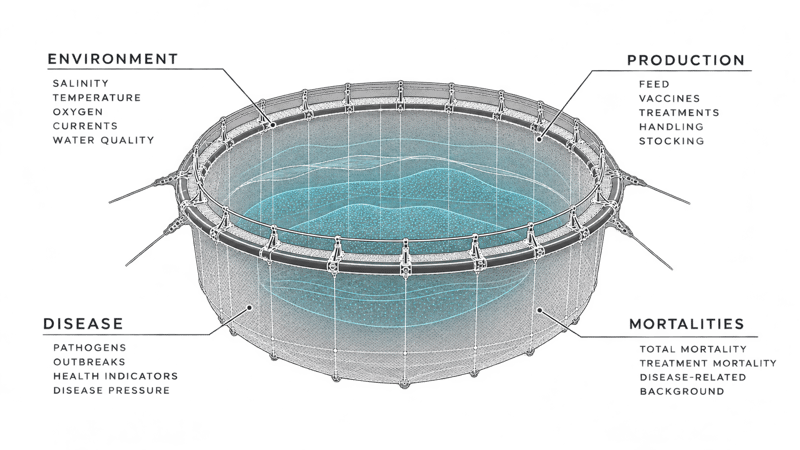
On top of that, there’s more data coming in than any team can reasonably watch, with feeding events logged by the second, mortality daily and biomass weekly. With that many signals across that many systems, knowing what to pay attention to turns into a job of its own.
Teams respond the way anyone would, by learning the two or three systems they need most and leaving the rest. The camera platform gets used for lice counts but rarely for appetite, and the environmental data gets checked once something already looks wrong. There’s simply more coming in than one team can keep up with, even when everyone is doing their job well.
And on most farms, one or two people know how it all fits together. They know which export to pull and how the spreadsheet works, and they spend a good part of their week putting out fires. When they’re out, the questions wait.
Volume is only part of the problem, though. The bigger issue is that no single system holds enough context to answer a question that spans several of them, whether that’s why a cage is falling behind on growth or whether a treatment actually worked. On a fish farm, almost every important question crosses those lines, and that’s where things get complicated.
Asking Questions From Complex Data
The questions farm teams ask are usually straightforward. What's happening at this cage, and why? If we do a partial harvest at this site, how does our growth forecast change? Is the new feed performing better than our feed last generation?
Answering them is a different story, because fish biology rarely gives any one system the whole answer. Growth depends on feed, temperature, oxygen, disease pressure and handling, and each of those is recorded somewhere different.
Why does a cage fall behind?
Take a cage that’s underperforming on growth. To understand why, you’d might start with growth and biomass from the production system, then pull feed delivered from the feeding system and appetite from the camera platform. You’d want temperature and oxygen from the environmental sensors to see whether conditions played a part, along with recent lice counts and any treatments. If the fish health team sent samples to the lab, the PCR results come from yet another portal.
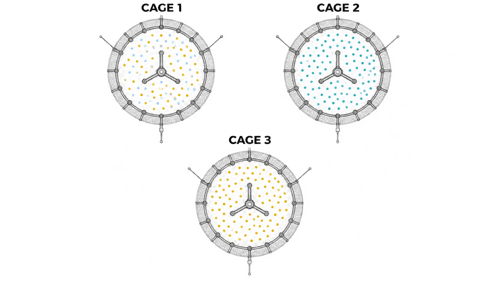
Then there’s one more detail to note. Last month, some fish from cage 3 were moved into cage 1, and they brought their own history with them, from the feed they were on to the treatments they’d had. Cage 1 is now a mix of two groups with different backgrounds. We’ve written more about this in why comparing biological aquaculture data is hard.
All in, that’s five or six data systems, a handful of exports and a spreadsheet before anyone gets close to an answer, and by then conditions in the cage may have already changed.
Today, a question like this usually means pulling exports, matching dates across systems and asking the one person who knows how it all fits together. When every source is already connected and cleaned, the same question can be answered in Watershed, in the Power BI report your team already uses, or by asking your AI assistant. Either way, the answer draws on all of those systems at once, including the fish that came over from cage 3.
Farms already have all the data to answer these types of questions. The value comes from connecting it, and that’s the piece most teams don’t have the time or tools to take on themselves.
What Farms Need: Someone to Conduct the Orchestra of Data
Think about an orchestra for a second. Every musician can be excellent on their own instrument, but without a conductor keeping time and bringing each section in at the right moment, even great musicians end up playing over each other.
A farm’s architecture of systems work much the same way. The production software, cameras, sensors, feeding system and lab services are all good instruments, and farms have invested in every one of them. What’s missing is something that brings them together to play one piece, whether that piece is a weekly report, a growth forecast or a harvest plan. That’s the role Manolin plays.
With the systems working together, managers can spend less time reconstructing what happened and more time on the decisions that move the farm forward, like when to treat, how to plan a harvest, or which ideas are worth testing to improve fish health and the bottom line. Here’s how Manolin does that, and where the API comes in.
How Manolin's API Works
Every farm on Watershed gets both the application and the API, and we set it up that way on purpose so no team has to choose one way of working over another. In the app, teams analyze their data, build custom reports and documents, track KPIs, and use tools like the treatment recommender, harvest planner, disease and performance models, and an area intelligence map with a national view of disease, treatments and sea lice. And while you're working, our software watches for risk signals across a farm’s private data and the public sources we bring in.
The data work happens first
Everything in Watershed runs on the same data foundation. Before data reaches any report, model or the API, Manolin structures, cleans and normalizes it, linking records from every system down to the cage level. Today that foundation covers more than 9.1 billion data points and 64 million fish traced, built on more than 30 years of data (here’s how the architecture works).
What the API adds
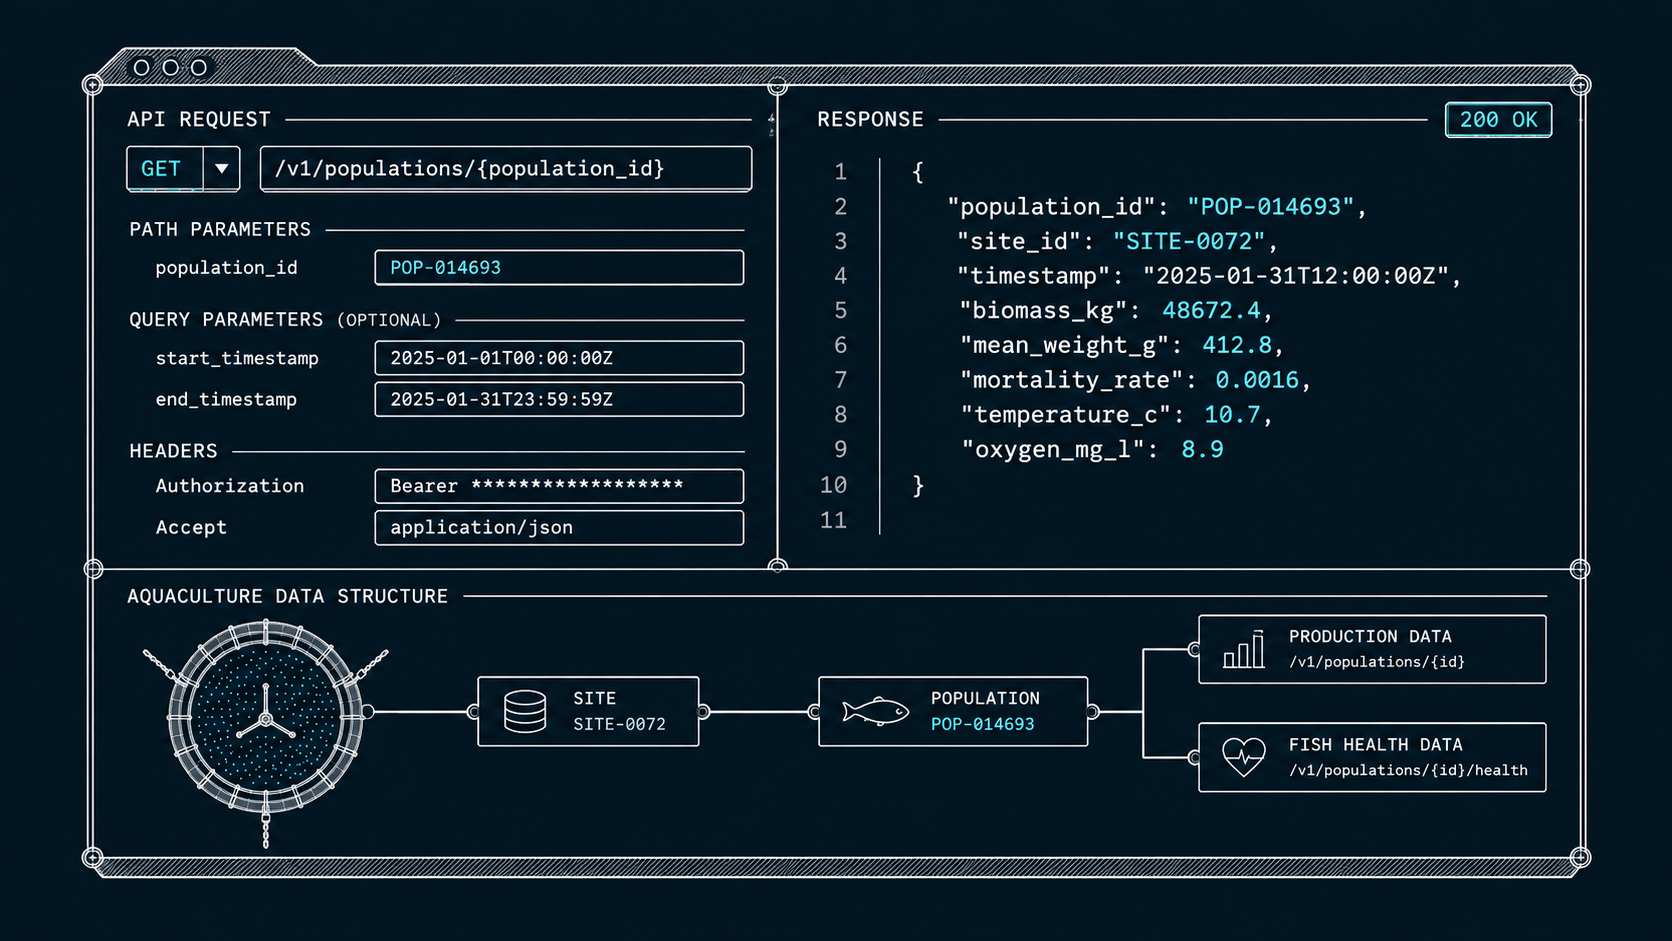
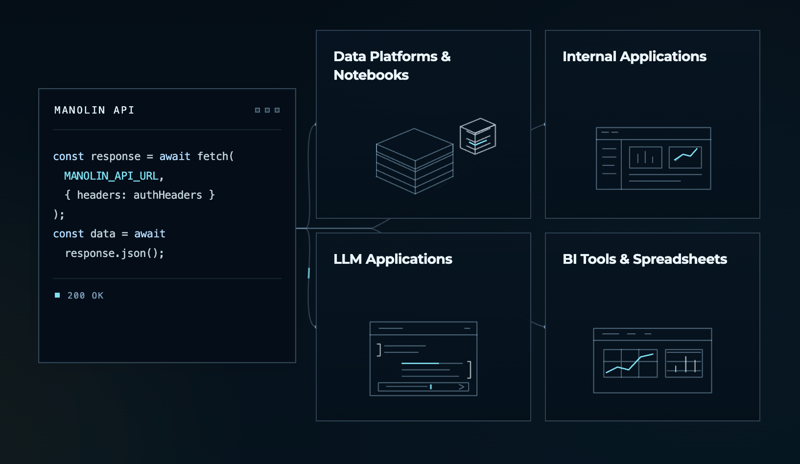
An API is a secure connection that lets one system request data from another. Manolin’s API gives your own tools direct access to the same cleaned dataset that powers Watershed, along with the modeling built on top of it.
Who sets it up
Manolin does. Your team shares the account information for your data sources, and we handle the integration work from there. We’ll work directly with your data team if you have one, or with whoever manages those accounts if you don’t, even if that’s spread across a few people on different teams.
Keep Using the Tools You Already Know
Through the API, farms can send their connected data wherever their teams already do their analysis. That might already be a data platform or Python notebook, an internal application the farm has built, Power BI or a spreadsheet, or an AI assistant like Claude, ChatGPT or Copilot.
Get more from the systems you’ve already built
Some farms have invested heavily in their own data setups, with internal platforms, dashboards and reporting built around how their teams work. That’s completely fine, and we don’t think anyone should feel pushed into another application to get value from their data, Watershed included. What we can do is feed those systems cleaner, structured data along with our modeling, so the tools you’ve already built become more useful than they were before.
Bring your data into the AI assistant you already use
Most companies have settled on an AI assistant by now, whether that’s Claude, ChatGPT or Copilot, and you shouldn’t need to switch to a new one to ask questions about your farm.
Right now, using an AI assistant with farm data usually means exporting a spreadsheet and uploading it into a chat. That works for a quick question, but the export is a snapshot that starts going out of date the moment it’s pulled. AI assistants also aren’t great at holding onto context across threads and documents, so the same files have to be loaded again for the next conversation. And when the data is messy, with mismatched cage names or gaps between systems, the assistant fills in the blanks with its best guess.
Connecting your assistant through Manolin’s API means it reads structured, current data every time you ask, without anyone loading files in by hand, and its answers draw on every system the farm has connected. Intelligence is only as good as the data underneath it, and this gives your assistant much better data to work with.
Why Farms Build on Manolin
The biggest reason is the infrastructure underneath. It was built specifically for aquaculture, it works for whatever species a farm raises, and it already handles the biology that general-purpose data tools struggle with. One API covers every data type a farm connects, from production and feeding records to camera, sensor, lab and public data.
We also take the integration work off the farm’s plate. Manolin builds the connections, keeps them running as suppliers update their systems, and does the data prep, so there’s no warehouse or lakehouse for your team to stand up and maintain.
Bringing Manolin's API Into Your Farm
Farms own their data and can export it whenever they want, and when it comes out of Manolin, it’s already cleaned, structured and normalized.
The process to start using our API for your farm team is simple. Once signed up, your team shares access to the systems you use today, we connect and clean the data, setup everyone up with their own Manolin account, and you can start working across both the Watershed application and the API.
If you’re ready to bring your farm’s systems together, talk to our team about what you’d like to build.