Back in the summer of 2019, my feed startup had begun our first real trial. We were small, our feed was untested, and a local trout farmer had agreed to run our product in his raceways alongside the feed he already used. Two months in, the numbers were actually looking pretty good, and our fish were performing rather favorably.
Then raccoons got into the raceways and ate most of the test fish. Our farm partner naturally had to end our trial, and we had to push the restart to the following spring. For a startup with one product and one farm partner, that meant five months of waiting, along with many more months before we got another result we could share.
The scale of our trial was small, but the design is one the industry has used for decades to test feed, genetics and vaccines. Raise comparable groups of fish side by side, give each a different product, and compare the outcomes. This is known as a common garden trial. But (as I had witnessed) when something goes wrong partway through, the ability to develop a comparative analysis goes right out the door.
What Is a Common Garden Trial?
The term actually comes from plant ecology. Back in the 1940s, Clausen, Keck and Hiesey popularized the common garden experiment in American ecology through their ecotype research, growing plants from different elevations together in one garden to see whether the differences between them were genetic or just a product of where they grew.
Aquaculture borrowed the same idea. You put two groups of fish in conditions that are as similar as you can get them, give each group a different product, and compare how they do. Researchers have used this design for years to study salmon genetics, and it’s common in Atlantic salmon research. On the commercial side, it’s how feed companies, genetics suppliers and vaccine makers show a farm that their product works, whether that farm raises salmon, trout or something else.
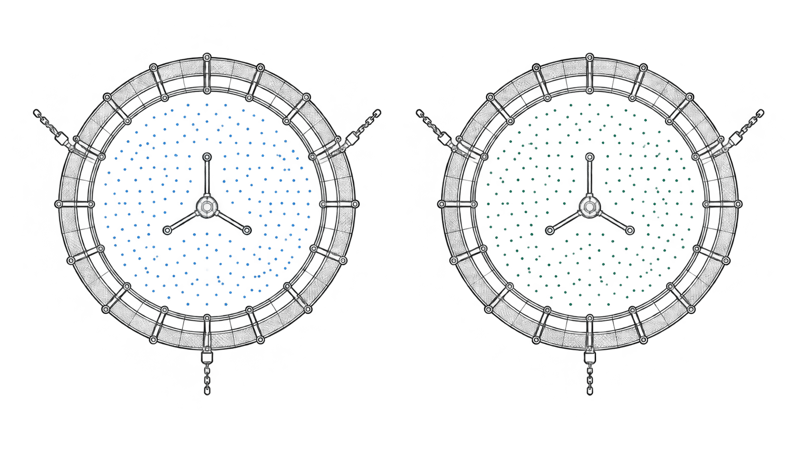
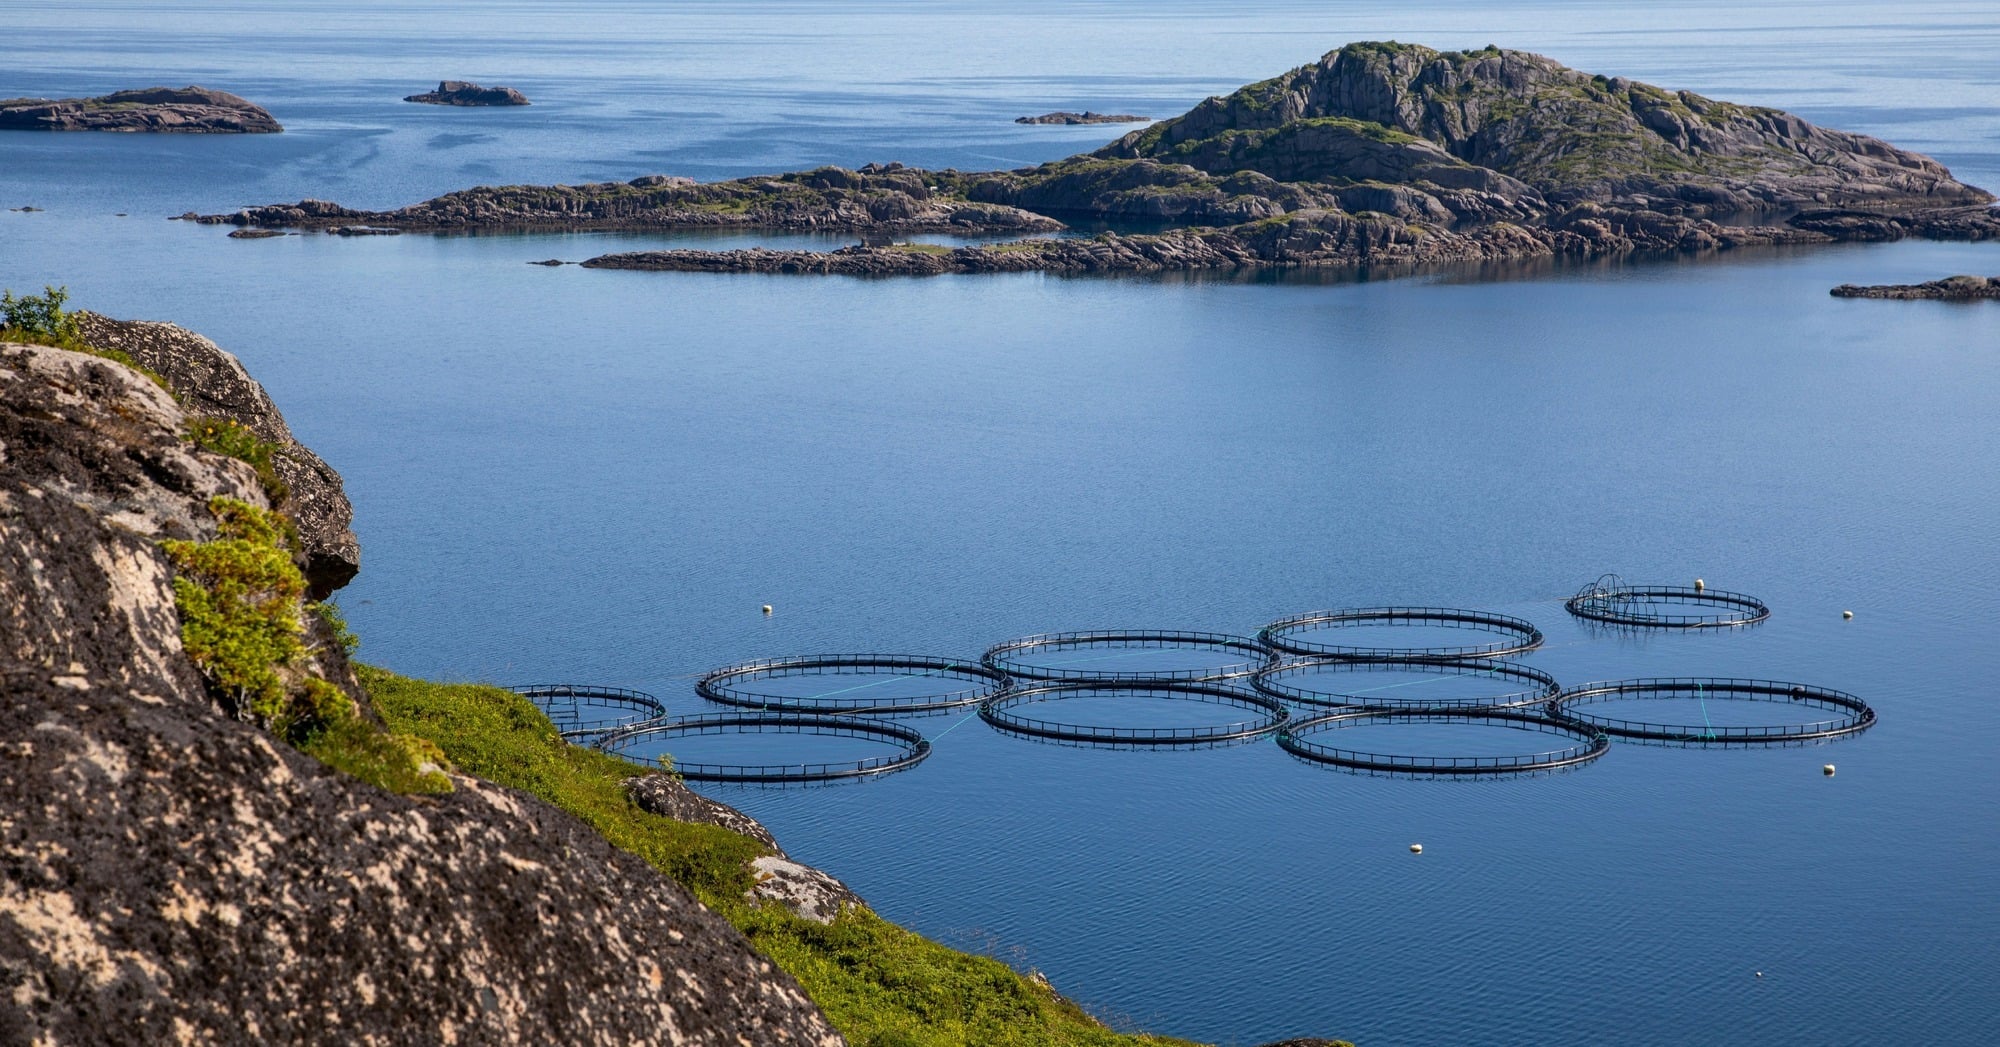
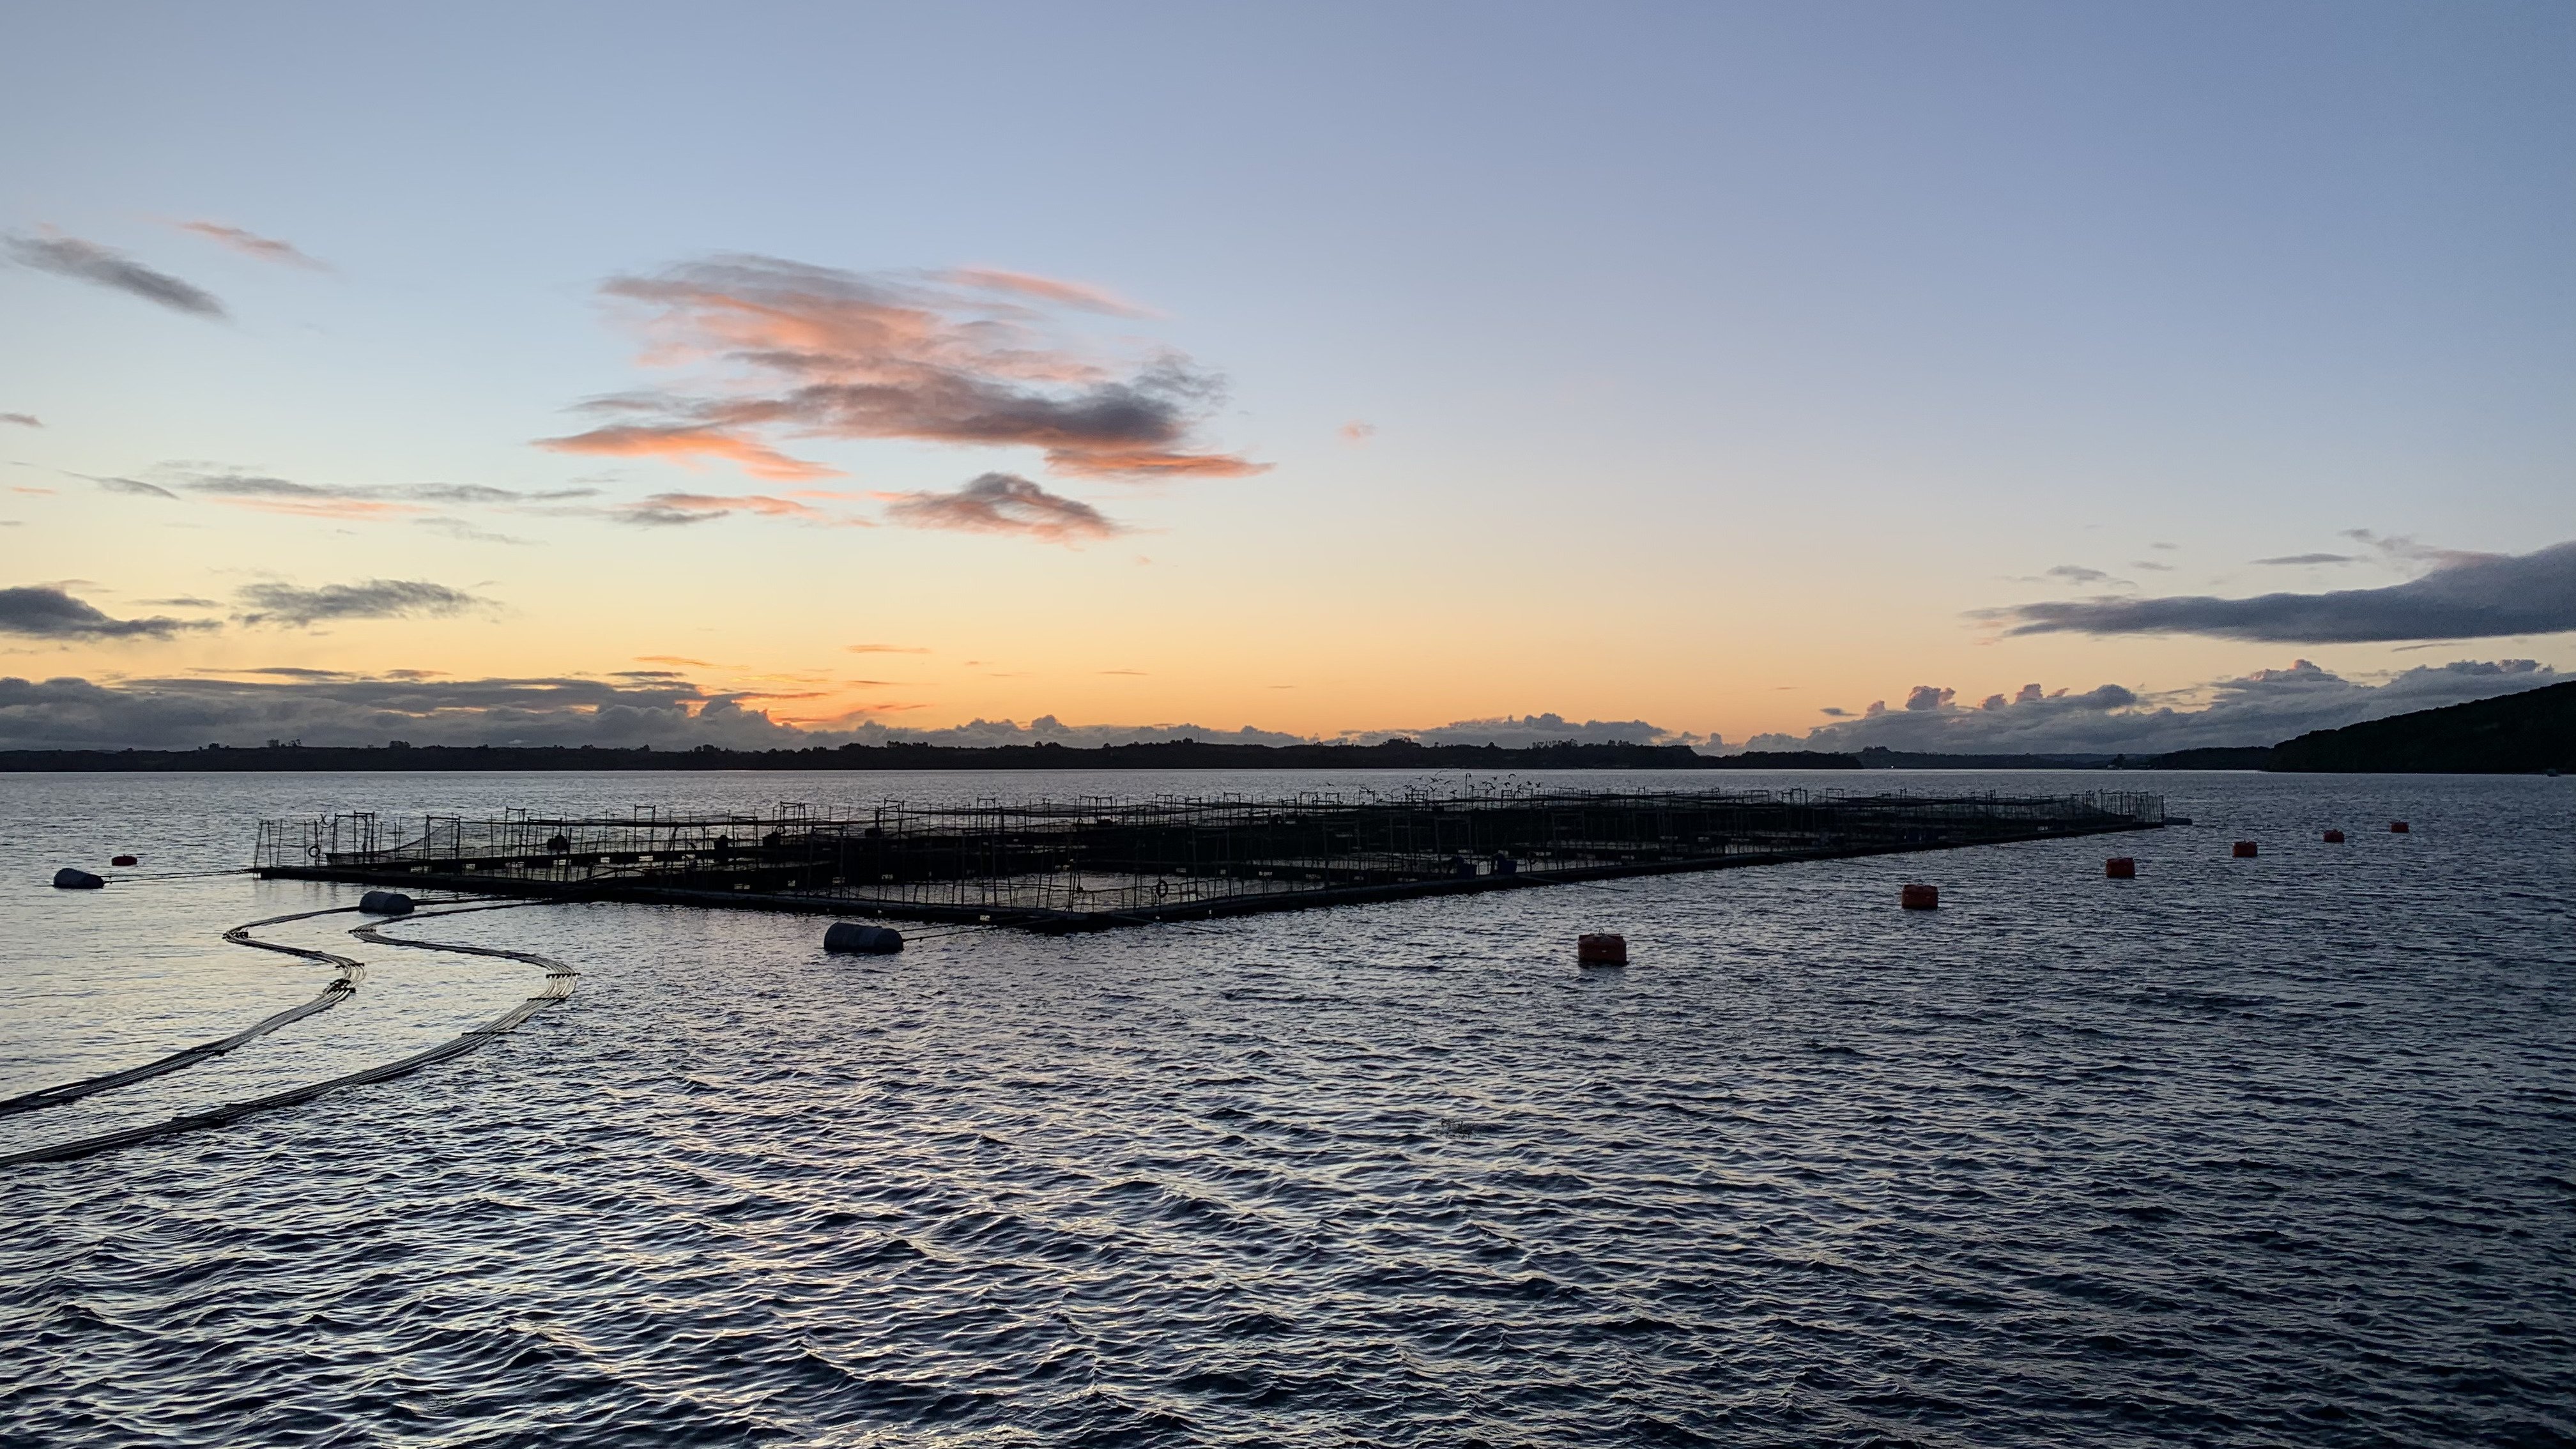
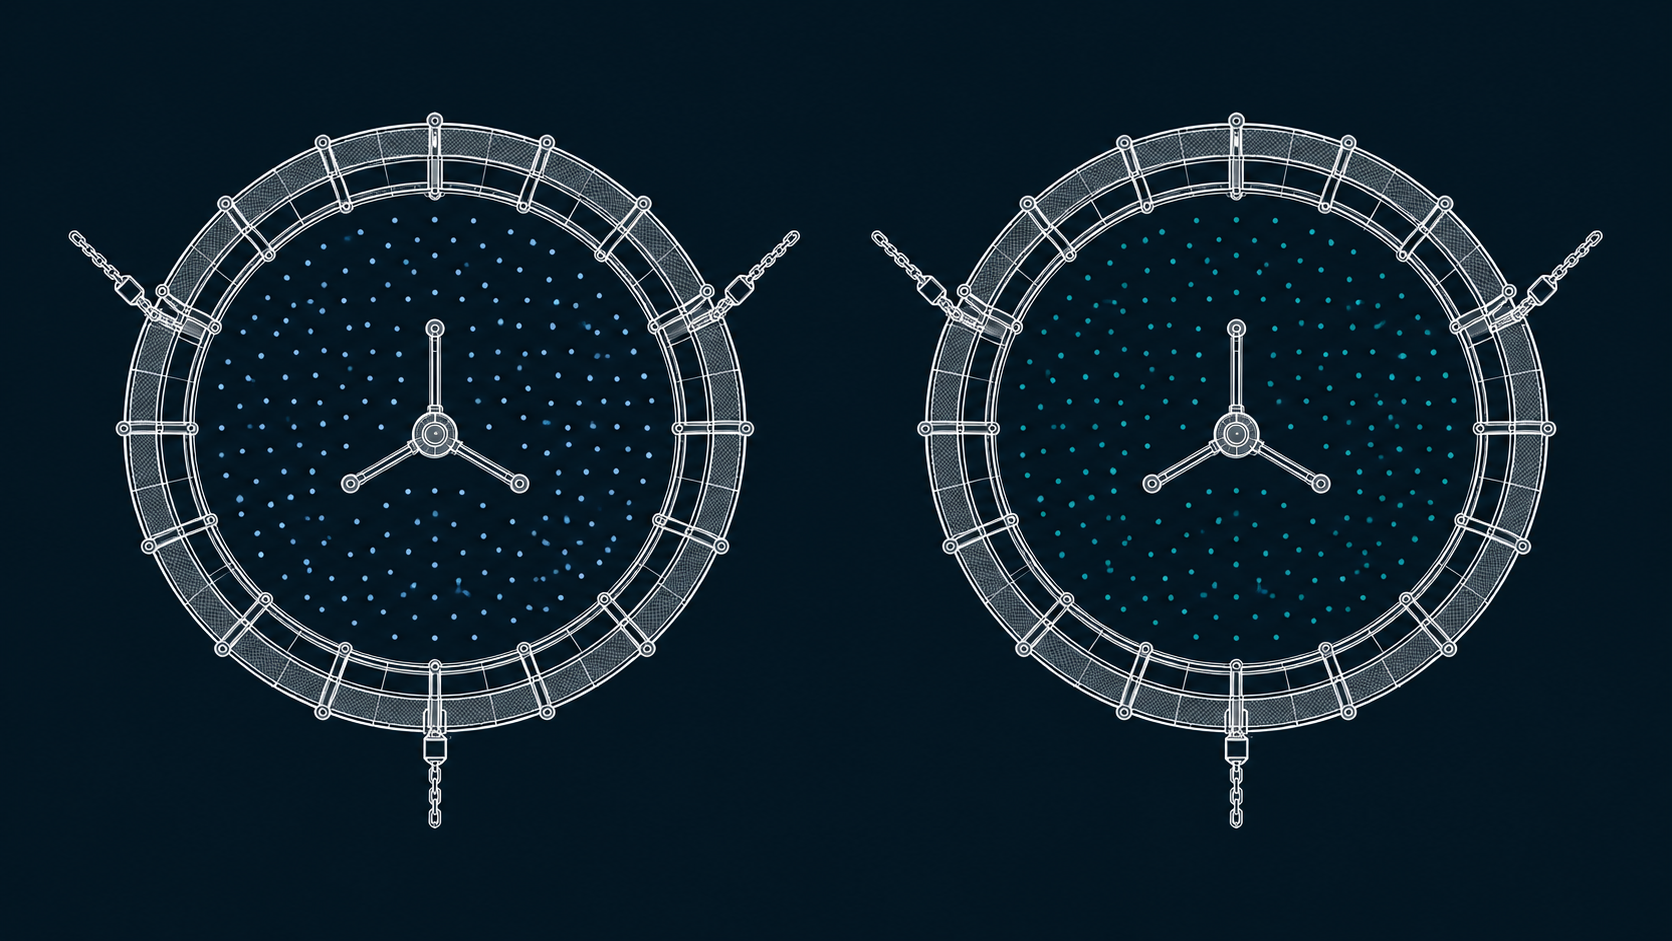
There are a few ways to set one up, and they vary in how tightly they control the environment. The most controlled version marks fish from each group and raises them together in the same cage. One PD vaccine study, for example, ran one study with PIT-tagged fish, another with group-marked fish, and a descriptive comparison of whole cages, but tagging takes a lot of work. The more common commercial setup uses separate cages at the same site. A genetics supplier might put its smolt in Cage 1 at a partner farm and a competitor’s smolt in Cage 2, then compare them over a generation at sea. Some trials go further and run the products at different sites altogether.
In commercial aquaculture, one practical approach is to compare products in separate cages at the same farm, sometimes across an entire production cycle.
What a Common Garden Trial Costs, and How Long It Takes
Trials (not surprisingly) aren’t cheap to run either. Public research projects give us a decent sense of the types of budget ranges needed. One Norwegian lice-prevention feed project, funded partly by FHF, planned large-scale trials with two test feeds and two control feeds per species and 50,000 to 100,000 fish in each cage, with listed funding of roughly NOK 10.6 million across the project, including lab work. In Scotland, a hemp-based salmon feed project put £332,525 toward an 18-month phase evaluating performance, welfare, gut health and feed efficiency at scale. At the smaller end, a 2019 estimate put a trial for a single feed additive at around $191,000.
Time also adds to each trial’s cost. That same 2019 estimate put even a single-additive trial at up to six months. In one FHF-funded feed trial, salmon got the test feed from May 2009 as 100-gram smolt until they passed 3 kilos the following year, so roughly a year for one answer on one feed.
So whether it’s a few hundred thousand dollars or several million kroner, plus a year or more of waiting, a lot is riding on each trial going well. Which makes it that much harder when something outside anyone’s control gets in the way (and in a common garden, there’s plenty that can).
What Every Common Garden Trial Has in Common
Two cages at the same site share a lot of comparable variables. Same water, same weather, same farm team. But over 12 to 18 months at sea, each cage still has its own experience. Where a cage sits within the farm can matter significantly. For instance, in one sea trial of a lice vaccine, the researchers chose not to randomize cage positions because the outermost cages could have favored whichever group landed there.
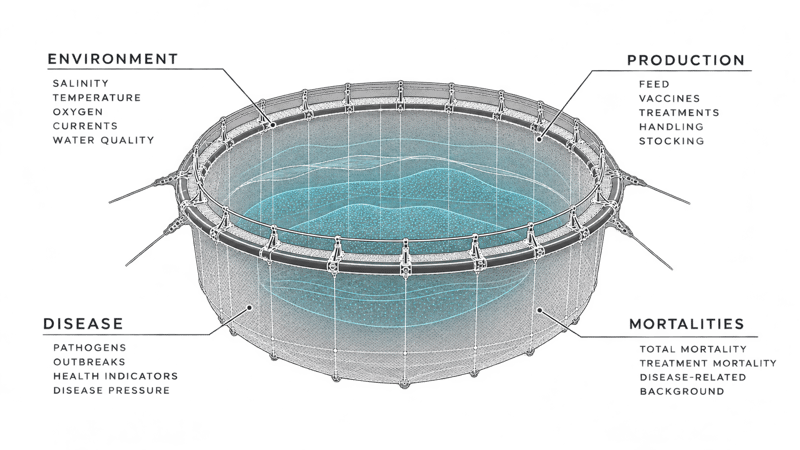
Then there are the random farm events that can throw everything off track. A full-scale feed trial in Norway ran into a pancreas disease outbreak, and a 15-month study on EPA and DHA levels in sea cages had a cardiomyopathy syndrome outbreak partway through. The lice-prevention feed project mentioned above had to base its cost-benefit assessment on earlier trials after a dosing error in 2018. In a full-scale test of a lice-prevention cage system, the team found it hard to get a representative sample once disease hit the salmon.
Our partner Veramaris ran into this same issue on one of their own commercial trials in Chile. That trial ran 114 days instead of the planned 184 for operational reasons, and the supplemented cages showed more variability, possibly due to predators as noted in the paper. The trial was published alongside a big data study Manolin ran with Veramaris in the same 2024 paper. As the research paper puts it, commercial-scale studies tend to run on a single farm with a few cages, and disease outbreaks are one of many reasons the cages can end up very different from each other.
On top of that, fish movements can create another analysis hurdle. Grading, splitting and emergency transfers all happen during a normal production cycle, and trial cages aren’t exempt. Say fish from Cage 3 have to be moved into Cage 1 halfway through. On a cage-level record, Cage 1 is now a mix of two groups with different histories, and there’s no clean way to say how much of its performance belongs to the product being tested.
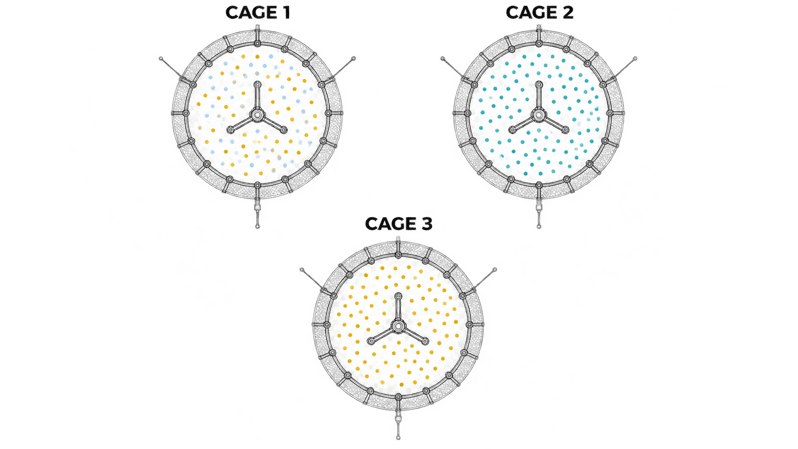
And of course, this isn’t anyone’s fault. It’s just the natural motions of farming fish. But it does mean the trial’s value depends a lot on how its data is set up from the start, so a disruption doesn’t erase the comparable expected result.
Setting Up a Common Garden Trial in Watershed
Before anyone starts comparing cages, the data should first be integrated: feeding, mortality, treatments, environmental readings and production records, which are usually spread across different systems. Watershed Reporting connects those records in one place, so the setup work is already done when a trial starts. Behind the scenes, our software makes sure the data is cleaned, normalized and traced at the population level, so each cage carries the history of the fish inside it.
Here’s how a two-cage feed trial looks in practice.
Choose your trial cages
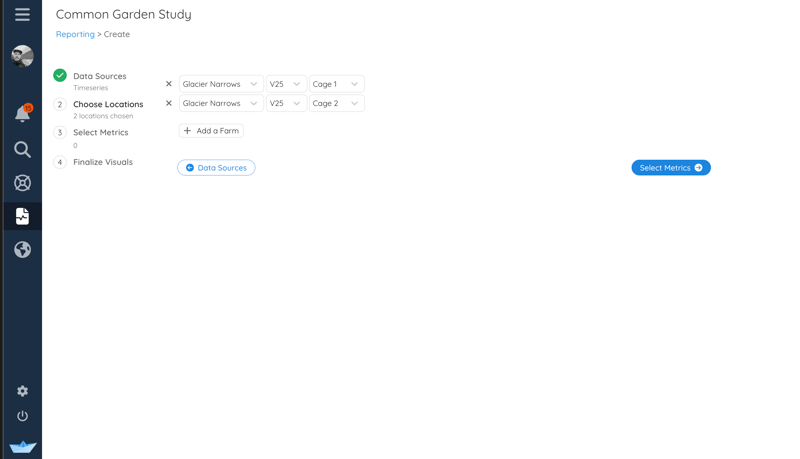
Start a new report from Reporting, then go to Choose Locations. Pick the farm, the generation and the cages in the trial, in this case Cage 1 and Cage 2 at the same site. If the trial spans more than one location, Add a Farm brings another site into the same report.
Pick the metrics you want to compare
Next, choose what to track. For a feed trial, that might start with fish loss and feed delivered, and you can add growth, treatments or any other metric your team follows.
View both cages on one chart, or side by side
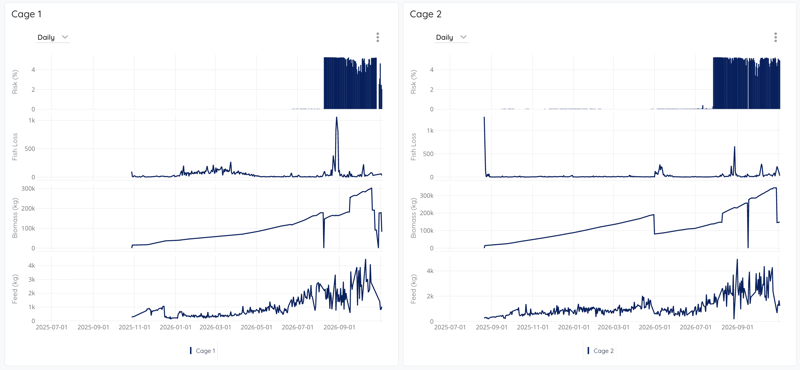
Watershed gives you two ways to look at the trial. You can put both cages on a single chart, so the lines sit on top of each other on the same timeline. Or you can use Add Visual to build Cage 1 and Cage 2 as separate panels next to each other.
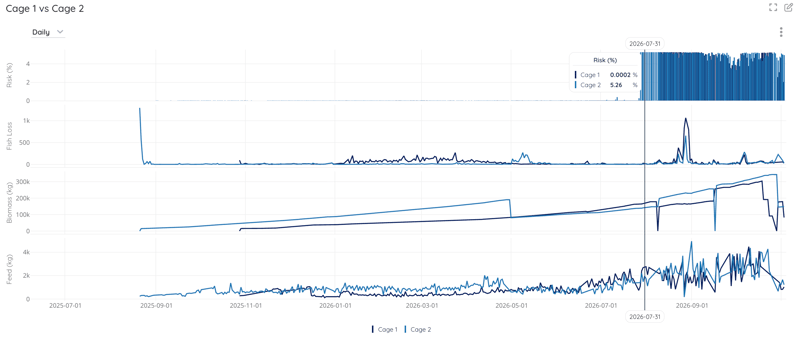 As seen in this example, this is where differences between cages start to show up. Two cages stocked from the same generation can still drift apart over the cycle. Here, Cage 1 carries higher fish loss through the first few months of 2026, Cage 2’s biomass drops sharply around May, and by the end of July, Cage 2’s disease risk sits above 5% while Cage 1’s is still close to zero. Having fish loss, biomass, feed and disease risk on one timeline makes those differences easy to spot, and easy to line up against what was happening on the farm at the time.
Filter by product usage across sites and cages
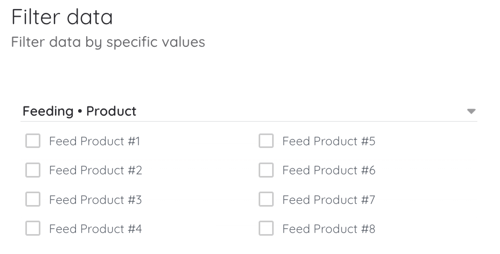
Report filters let you take the comparison a step further by narrowing each cage to the specific feed products it received. That way, the trial results you’re looking at reflect the products being tested.
Once the report is built, you can save it and come back to it as the trial runs, with the layout arranged the way your team reviews it. Export any of your graphics to pull the raw data in an excel spreadsheet to analyze further directly yourself or connect the Watershed API that's tied to your user account and chat with your preferred LLM to have conversations about your trial data directly.
All these platform capabilities are designed so our partners can handle a trial that goes to plan. And when it doesn’t, there’s more Manolin can do as well.
Going Deeper When a Trial Goes Off Track
Remember the fish from Cage 3 that had to move into Cage 1? Because the data is traced at the population level, Cage 1’s record doesn’t just become one blended group. It holds both populations and their separate histories, so the fish that started the trial can still be followed and compared through the rest of the cycle. This is the same population tracing method used in our 2026 peer-reviewed study with Veramaris, where fish were traced from stocking to harvest and grouped by shared production history.
When teams want to dig into a trial further, our customer account team can do that analysis with them, whether that’s a closer look at what happened in one cage or ongoing reports (like a feed analysis) throughout the year.
Where it gets more interesting is Manolin’s data network, and the extra value it can bring to trial work you’re already doing. A two-cage common garden evaluates only one product per cage, so if one cage sits in a better spot or starts with stronger fish, it’s hard to separate that discrepency from the product itself. Plant breeders handle this by testing new varieties across many different environments, instead of relying on a single field, and our data network lets a trial work in a similar way. Other farms have very likely fed the same two products at some point, so we can look across anonymized network data for sites and populations that saw similar conditions (region, water temperature, smolt size, treatment history and more) and bring them into the evaluation alongside your trial. That gives a single two-cage trial a lot more comparable context to stand on.
In that same 2026 study, Manolin and Veramaris used this approach across more than 430 million Atlantic salmon and 556 generations, with a statistical method called IPWRA to adjust for differences between populations like smolt size, time in sea, environmental exposure, lice treatment history, vaccination and disease incidence. And while this study is an example for feed ingredients, the same exact approach works for comparing other farm products such as genetics and vaccines.
Getting More Out of Your Next Product Trial
Common gardens aren’t going anywhere, and they shouldn’t. They’re still the most direct way to see how a product performs in real farm conditions. What changes is how much a single trial can tell you, and how much of it you can still use when the biology doesn’t cooperate.
Comparisons built from network data have their limits too. Even with careful adjustment, the 2026 study notes that some confounding can remain, and they work best alongside a designed trial, not instead of one. But together, they give you a much better chance of getting a result you can stand behind, even when something goes wrong partway through.
If you’re planning a trial, or one is already underway, talk to our team about how to set it up in Watershed and where we can take the analysis further.